集群server端
Prometheus监控系统
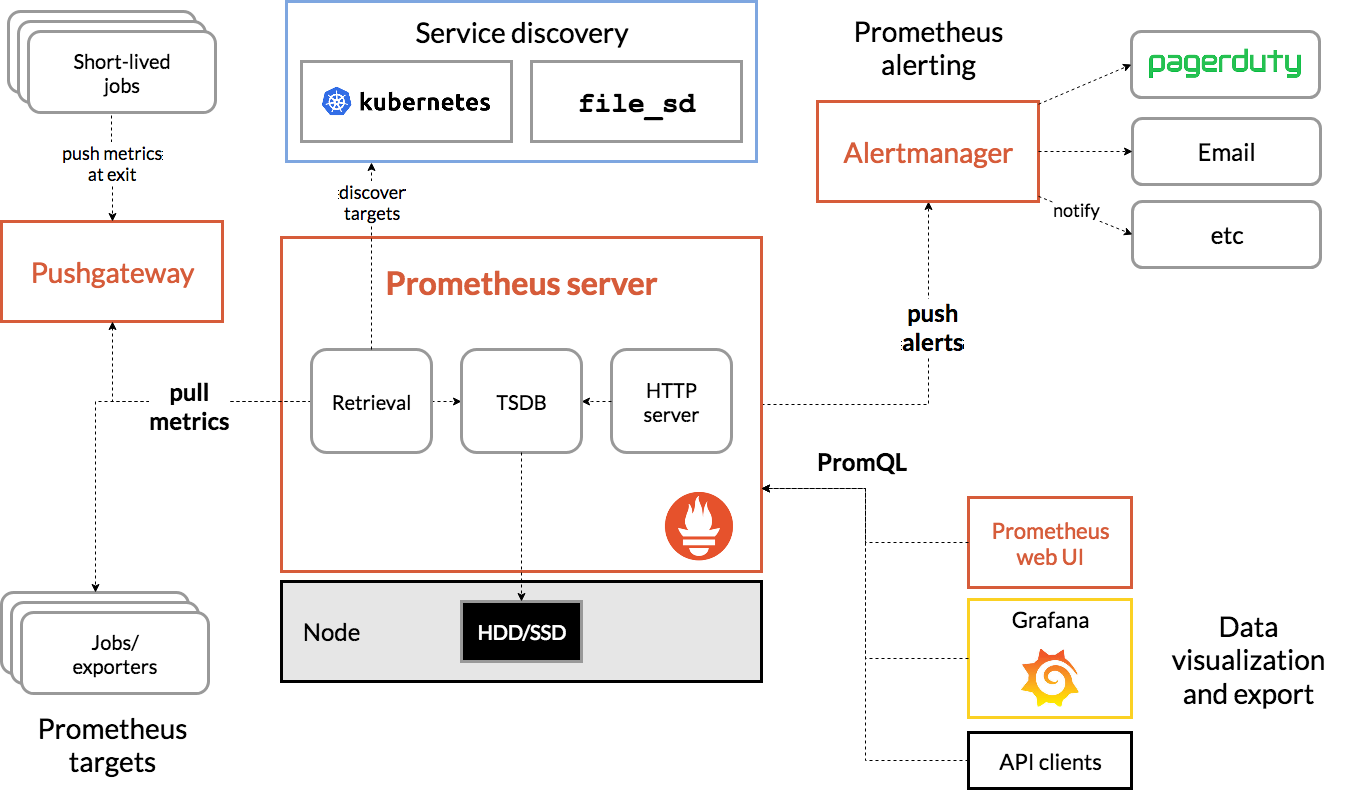
通过http协议从远程的机器上收集数据并存储在本地的时序数据库上
- 怎么采集数据的
- 怎么存储数据的
- 怎么暴露 接口的
- 存储和采集数据有哪些可配置的参数
安装
服务端
下载https://prometheus.io/download/
解压到/opt/prometheus
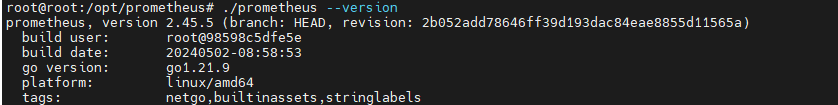
启动指定命令
指定配置文件
–config.file=”prometheus.yml”
默认指定监听地址端口,可修改端口
–web.listen-address=”0.0.0.0:9090”
最大连接数
–web.max-connections=512
tsdb数据存储的目录,默认当前data/
–storage.tsdb.path=”data/“
premetheus 存储数据的时间,默认保存15天
–storage.tsdb.retention=15d
通过命令热加载无需重启 curl -XPOST 192.168.2.45:9090/-/reload
–web.enable-lifecycle
可以启用 TLS 或 身份验证 的配置文件的路径
–web.config.file=””
将prometheus注册服务
[Unit]
Description=prometheus service

[Service]
User=root
ExecStart=/opt/prometheus/prometheus --config.file=/opt/prometheus/prometheus.yml --storage.tsdb.path=/opt/prometheus/data

TimeoutStopSec=10
Restart=on-failure
RestartSec=5

[Install]
WantedBy=multi-user.target
systemctl daemon-reload
systemctl enable prometheus
systemctl start prometheus
systemctl status prometheus
客户端
安装node_exporter
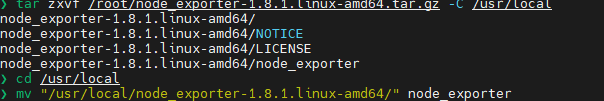
启动
node_exporter.service
再在服务端prometheus配置文件中加入任务信息
转载请注明来源,欢迎对文章中的引用来源进行考证,欢迎指出任何有错误或不够清晰的表达。